

Understanding Forex Trading Basics in South Africa
📈 Explore the essentials of forex trading in South Africa: understand currency pairs, effective strategies, market risks, and steps to start trading confidently.
Edited By
Charlotte Hughes
Forex trading isn't just about guessing whether the rand will rise or fall against the dollar; it’s a careful craft built on understanding patterns, trends, and market behavior. For traders in South Africa, mastering technical analysis can be the difference between making sound decisions and throwing darts blindfolded.
This guide jumps right into the practical aspects of technical analysis, showing you how to read forex charts, use indicators, and recognize chart patterns that signal opportunities—or warnings. The goal here is to give you a solid foundation you can actually apply, not just theoretical fluff.
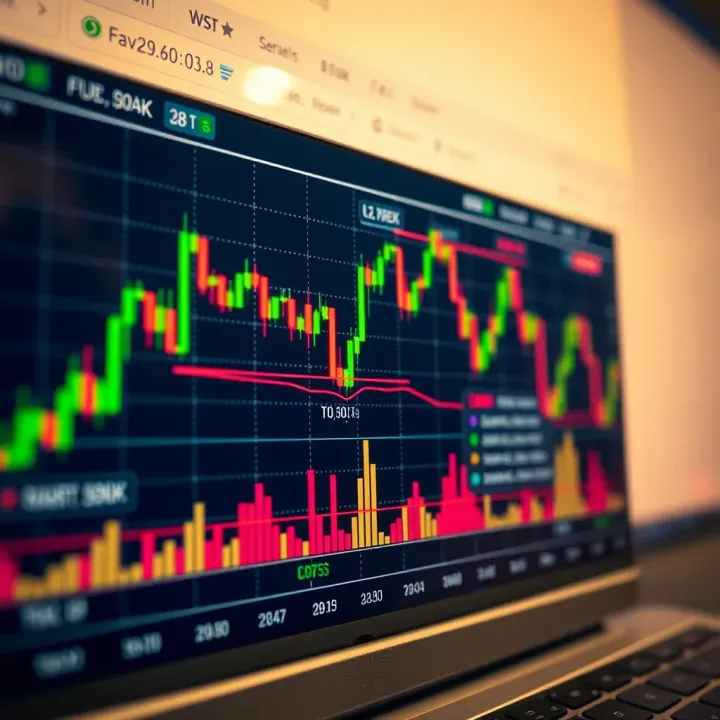
Whether you’re a new player trying to get your bearings or an experienced trader wanting to sharpen your edge, you’ll find useful tactics geared toward the realities of the South African forex market. The article also points toward helpful PDF resources to deepen your understanding and ensure your strategies stand up in real trades.
Understanding technical analysis is less about predictions and more about probabilities. It guides you to interpret market data smarter, limiting guesswork in an often unpredictable market.
In the sections ahead, we’ll cover:
Key chart types used in forex trading and how to interpret them
A selection of indicators that provide clear signals on market movements
Recognizing chart patterns that hint at what may happen next
Practical advice on combining these tools to make informed decisions
The forex market can be fast and unforgiving, but with the right technical toolkit, you’ll be better prepared to ride the waves instead of wiping out.
Understanding forex technical analysis is the bedrock for anyone serious about trading currency pairs. It’s not just about looking at charts but grasping how price movements reflect trader psychology and market dynamics. Whether you’re a seasoned trader or just starting out, getting a solid handle on the basics can help you spot opportunities and avoid common pitfalls.
Think of technical analysis as reading the market’s mood through its past behaviour. This helps take the guesswork out of trading decisions and brings some method to the madness of price swings. For South African traders especially, understanding these basics means you can adapt strategies to local market conditions and global influences, boosting your edge.
Technical analysis in forex is all about using past price data to predict future moves. While it doesn’t guarantee profits, it gives you a way to gauge potential price paths based on historical trends. This is important because forex markets are noisy and influenced by countless factors — technical analysis helps cut through the chatter by focusing on the price action itself.
For example, if the EUR/USD pair has bounced off a certain price point multiple times, recognizing this level can help you decide where to place your trades or stop losses. It’s a straightforward way to make informed decisions rather than trading on a whim.
The main difference lies in the focus: fundamental analysis looks at economic indicators, geopolitical events, and news reports to predict price changes. Technical analysis, by contrast, relies purely on price charts and volume data. It assumes all relevant information is already reflected in the market price.
Imagine fundamental analysis as checking the weather forecast before heading out, while technical analysis is like observing the clouds and wind at the moment. Both have value, but technical analysis offers real-time insight that’s critical for timing trades, especially in the fast-paced forex market.
Price doesn’t move randomly; it’s driven by trader behavior—fear, greed, confidence, and hesitation. Technical analysis studies these price movements because they reveal collective sentiment. When prices surge, it often reflects optimism; a dip might signal panic or profit-taking.
Consider the USD/ZAR pair during a political event: traders' reactions cause rapid price changes. By analyzing these movements, you can anticipate trends or reversals based on how the market digests information.
Markets tend to move in trends—up, down, or sideways. Spotting a trend early lets you align your trades with the dominant market force. Patterns like head and shoulders, double tops and bottoms, or flags signal potential trend changes or continuations.
For example, a double top in GBP/USD often signals a reversal from a rising trend to a falling one. Recognizing this pattern can prevent you from holding onto a losing trade for too long.
Support and resistance are key price levels where the market tends to pause or reverse. Support is where buying interest stops prices from dropping further; resistance is where selling pressure stops prices from climbing.
Let’s say the USD/JPY pair repeatedly bounces off 110.50—that’s a support level. Knowing this, you might place buy orders near that price with a tight stop loss just below it, managing risk effectively.
Understanding these basics is like learning to read the market’s language—once fluent, you trade with more confidence and less guesswork.
By mastering these fundamentals of forex technical analysis, South African traders can better navigate the complex currency markets and build strategies tailored to their trading style and risk appetite.
When it comes to forex trading, knowing how to read charts is non-negotiable. Charts are like your map and compass—they show you where the market has been and hint where it might go next. Different chart styles give you different views on the price action, so understanding the strengths and quirks of each is essential. Whether you're scanning for quick moves or plotting longer trends, choosing the right chart type and timeframe can literally make or break your trading day.
Line charts are the simplest. They connect closing prices over your selected timeframe with a single continuous line. This smooths out noise and gives a quick snapshot of price direction. For beginners or those wanting a clean overview, line charts are useful, but they don’t show much detail about volatility during a period.
Bar charts take it a step further by showing the open, high, low, and close prices for each timeframe. The vertical bar reflects the price range, while horizontal ticks on the left and right represent opening and closing prices respectively. Bar charts give you more info on market sentiment and are handy for spotting reversals or price spreads.
Candlestick charts add a visual punch by using boxes (“candles”) shaded differently depending on whether the price moved up or down. They pack the same data as bar charts but present it more vividly. Recognising candlestick patterns like doji, hammer, or engulfing candles can provide clues about potential market turns. Forex traders often prefer candlesticks for their intuitive visual cues and ease of spotting patterns.
Look beyond just the price points; focus on how candles or bars form sequences. For example, a series of long green candlesticks suggests buyers are charging; conversely, long red ones indicate selling pressure. Wicks or shadows on candles tell a story too—long upper shadows show rejection of higher prices, hinting at resistance, while long lower shadows suggest support holds.
Imagine you're watching the EUR/ZAR pair. If you spot a doji candle after a strong upward run, it indicates indecision—bulls and bears are fighting it out. This is a red flag to pause or tighten stop losses because the trend might be stalling. Visual patterns from charts let you react before numbers on their own would.
Timeframes are the time window each candle or bar represents—could be one minute, five minutes, an hour, or even a day. Short-term charts (like 1-15 minutes) are popular among scalpers and day traders who want to catch quick moves. They show more noise but also more trading opportunities within a day.
Long-term charts (daily, weekly) smooth out daily jitters and highlight bigger trends. Swing traders or position traders rely on these to avoid getting whipsawed by random blips. For instance, a South African trader investing in USD/ZAR might use daily charts to find major trend changes, then zoom into hourly charts to time entries and exits.
Picking a timeframe without considering your trade style is like choosing shoes without checking the terrain. Day traders need fast, detailed charts, whereas long-term investors benefit from broader views.
Some traders use multiple timeframes to stack their analysis—starting with a daily chart to understand the overall trend, moving to a four-hour chart for spotting entry points, then hitting a 15-minute chart to nail the timing exactly. This layered approach helps avoid blind spots and makes decisions more confident.
Remember, the goal is to align your chart type and timeframe with how actively you trade and the kind of price info you need, so you’re not overwhelmed or misled by cluttered or sparse data.
In short: knowing your charts and timeframes gives you a tactical edge in navigating forex markets, especially something as volatile as USD/ZAR or GBP/ZAR pairs common in South Africa trading circles.
Technical indicators are tools that traders use to make sense of price data and forecast what might happen next. In forex trading, where every second counts, these indicators give traders a quicker way to interpret the market without getting bogged down by too much raw data. They’re essential because price charts alone might not always tell the full story, especially in a market as liquid and volatile as forex.
Think of indicators like a second pair of eyes—helping you spot trends, momentum, or even turning points you might miss otherwise. But remember, no indicator is perfect. Using several indicators in harmony often leads to better trading decisions. In this section, we’ll look at some of the most common ones that South African traders lean on, focusing on moving averages, momentum indicators, and volume-based tools.

Moving averages (MAs) smooth out price data to highlight the overall direction of a currency pair. The two most popular types are the Simple Moving Average (SMA) and the Exponential Moving Average (EMA). The SMA calculates the average price over a certain period—say 20 days—giving equal weight to every price within that range. The EMA, however, puts heavier weight on recent prices, which means it reacts faster to new market action.
For example, if you’re watching the USD/ZAR pair and a sudden price jump happens today, the EMA will reflect this jump more quickly than the SMA. This makes EMAs better for traders who want to catch trends early. But this quickness can also lead to more false alarms in sideways markets. SMAs are more stable but slower to react.
Moving averages help identify when a trend is forming or fading. Picture it like this: when a short-term moving average crosses above a long-term moving average, it’s often seen as a bullish signal—meaning the price could keep rising. This is called a “golden cross.” The opposite, known as a “death cross,” happens when the short-term average falls below the long-term average, indicating potential downside.
South African traders often use the 50-day and 200-day moving averages on longer timeframes to spot these trends. For shorter-term scalpers, a 9-day or 21-day EMA on an hourly chart might be more useful. The key is to pick settings that suit your trading style. A clear trend can help you avoid jumping into trades that just bounce around without direction.
Momentum indicators show the speed or strength of a price movement. The Relative Strength Index (RSI) and the Moving Average Convergence Divergence (MACD) are two favorites. RSI measures whether a currency is overbought or oversold on a scale from 0 to 100. When RSI crosses above 70, it might mean the currency is overbought and due for a dip; below 30 suggests it might be oversold and ready for a bounce.
MACD looks a bit more complex—checking the relationship between two moving averages and the difference between them. When the MACD line crosses above its signal line, that often signals a bullish momentum shift, and the opposite signals bearish momentum. These can prompt timely entry or exit points.
With RSI, traders often wait for those clear levels at 30 and 70 to trigger action. But more savvy traders also look for divergence—when price makes a new high but RSI doesn’t, it hints momentum is weakening and a reversal may come.
MACD signals include:
Crossovers: When the MACD crosses its signal line
Zero-line cross: When MACD moves above or below zero, indicating the trend
Histogram changes: Growing or shrinking bars suggest strengthening or weakening momentum
These signals aren’t foolproof, but combined with price action or other tools, they can improve timing significantly.
Volume shows how active a currency pair is during a given time, tracking how many trades or contracts are exchanged. High volume often means stronger conviction behind price moves, whereas low volume can indicate hesitation or uncertainty.
In forex, direct volume info can be tricky because there’s no central exchange like the stock market. Still, some brokers and platforms offer tick volume, which counts price changes instead. While not perfect, it gives traders a rough idea about market participation.
The real power of volume comes when it’s combined with price movement. For example, a price breakout on heavy volume is more trustworthy than one on light volume. This can mean the difference between a false breakout and a real trend forming.
If the USD/ZAR pair breaks a resistance level with a spike in volume, it suggests strong interest and possibly a new uptrend. Conversely, if volume is low during the breakout, it may fail and the price could reverse.
Pay attention to volume spikes during important news releases or market hours. These often confirm the strength behind sudden price moves and help you avoid getting caught on the wrong side.
Combining multiple indicators thoughtfully keeps you from relying too heavily on one signal, reducing mistakes and improving your trade timing.
Putting knowledge of these popular technical indicators into practice is a solid next step. They act as a toolkit, helping you cut through the noise frequently seen in forex markets and spot genuine opportunities tailored to the fast-moving South African trading environment.
Chart patterns play a critical role in forex technical analysis. They offer visual cues that help traders predict future price movements based on historical data. Recognising these patterns allows traders to make informed decisions about entry and exit points, improving their chances of success. Beyond just spotting trends, chart patterns reveal shifts in market sentiment and potential reversals, which is especially useful in volatile forex markets like those affecting the South African rand.
By studying chart patterns, traders can better anticipate market behavior without relying solely on numerical indicators. For instance, a well-formed pattern might signal a trend reversal before any indicator confirms it. This early insight can make the difference between catching a big move and missing out.
Basic chart patterns such as Head and Shoulders, Double Tops, and Double Bottoms are foundational tools in any trader’s arsenal. The Head and Shoulders pattern, for example, forms when a peak (the head) is flanked by two smaller peaks (the shoulders), signaling a potential trend reversal from bullish to bearish. The reverse, an inverted Head and Shoulders, suggests a shift from bearish to bullish.
Double Tops and Bottoms indicate resistance and support levels that the price has tested twice. A Double Top is formed when the price hits a high point twice but fails to break through, often preceding a downward move. Alternatively, a Double Bottom signals a price floor, hinting at an upward reversal.
Understanding these formations helps traders prepare for changes in market directions instead of reacting late to price movements. Shape, symmetry, and volume during these patterns also add layers of confirmation.
Imagine trading the EUR/USD pair where you spot a classic Head and Shoulders pattern forming over a daily chart. Once the price breaks below the “neckline” -- the level connecting the two troughs between the shoulders and the head -- it’s a strong sell signal. Traders can set stop-loss orders above the neckline to manage risk.
In another case, the USD/ZAR might form a Double Bottom during a prolonged sell-off. When the price bounces off this level twice, traders might enter long positions anticipating a rebound, especially if volume picks up on the second bottom. Confirming oscillators like RSI can further validate these signals.
Recognising and acting on these chart patterns early can help South African forex traders avoid the whipsaws common in the rand’s unpredictable environment.
Flags and pennants are short-term continuation patterns that indicate temporary pauses in a strong trend before the price continues in the same direction. Flags look like small rectangles sloping against the trend, while pennants resemble small symmetrical triangles.
To spot these, traders should look for sharp price moves forming a “flagpole,” followed by a consolidation phase with reduced volatility. This phase creates the flag or pennant shape. Identifying these patterns typically requires looking at 15-minute to 1-hour charts for short-term traders, but longer timeframes can apply for swing traders.
Recognising these shows that the market is taking a breather, not reversing. It’s like a runner catching breath before sprinting further.
Continuation patterns can be powerful confirmations for trades already aligned with the prevailing trend. For example, if a trader sees an upward trend supported by a bullish pennant forming, they might choose to add to their position once the price breaks above the pennant’s resistance.
A practical tip is to wait for the breakout with increased volume to confirm the move. Placing stop-loss orders just below the pattern’s low helps protect against false breakouts.
Let’s say you’re watching GBP/USD during a strong uptrend and spot a flag pattern. When the price breaks upward out of this pattern, it’s usually a green light to enter or hold a buy trade. Ignoring this can mean missing out on a sizable chunk of profit.
Using continuation patterns like flags and pennants lets traders ride trends with more confidence, an essential skill in the fast-paced forex markets.
By mastering these basic and continuation chart patterns, forex traders can significantly enhance their market timing and risk management strategies. These patterns complement technical indicators and provide a fuller picture of market dynamics, crucial for trading pairs like USD/ZAR, EUR/USD, or GBP/USD that South African traders often focus on.
Using PDF resources in forex trading technical analysis offers a practical way to deepen your understanding and sharpen your skills without getting bogged down by endless scrolling or internet distractions. For traders in South Africa, well-chosen PDFs provide compact, reliable information that's easy to access anywhere—from a cozy cafe to a busy office. PDFs let you study at your own pace, revisit tricky sections, and build a solid knowledge base you can trust.
PDF guides often bring together complex ideas into digestible chunks, using clean layouts and well-structured formats. This makes it simpler to review the essentials of forex charts, indicators, and patterns without needing to flip through multiple pages or screens. Plus, since these resources can be stored offline, you’re not tied to being online all the time—great for those moments with spotty connectivity or when you want to focus without distractions.
One of the best things about PDFs is their convenience. Once downloaded, you can study forex strategies anywhere, anytime, without worrying about internet access. Imagine you're on a long commute or away from reliable wifi—having a PDF with clear charts and step-by-step explanations means you can still learn and revise your trading approach.
This easy reference capacity allows you to quickly revisit topics like candlestick patterns or moving averages without preparing lengthy notes or bookmarking pages online. In practice, when a trade doesn’t go as expected, you can pull up your PDF, check the logic behind your strategy, and adjust without delay. This kind of ready-to-hand resource saves time and keeps you sharp.
PDFs are not just textbooks; they complement the real-world act of trading. Many guides include exercises, examples, or mini-quizzes right after explanations, helping you apply what you’ve read immediately with demo accounts or during market analysis.
For example, after learning about the Relative Strength Index (RSI) from a PDF, you can jump onto MetaTrader 4 or TradingView, check live charts, and practice spotting overbought or oversold conditions. This combination of study and doing reinforces your learning much better than theory alone.
A seasoned trader in Johannesburg once shared how offline PDFs helped them master the nuances of MACD divergence when their internet skipped out during peak trading hours. That kind of hands-on learning backed by a solid resource is priceless.
When picking a technical analysis PDF, clarity is king. You want resources that don’t just pile up jargon but break down concepts in simple language. Visuals are equally important—look for plenty of annotated charts and real examples rather than vague descriptions.
A good PDF might explain how a "head and shoulders" pattern forms, then follow with screenshots from actual forex charts, laying out entry points, stop loss placements, and take profit levels. This practical detail makes it easier to replicate the approach on your own.
If a guide overwhelms you with complicated formulas or skips the "why" behind strategies, it’s better to pass. Good PDFs act like a mentor—patient, clear, and straightforward.
Forex markets never sit still, and neither should your study materials. An effective technical analysis PDF should reflect recent market conditions, tools, and trading platforms used today. For instance, explanations involving platforms like MetaTrader 5 or the latest TradingView features show the PDF creator is in tune with modern trading demands.
Look out for PDFs updated within the last year or so, especially those referencing volatile market events like Brexit or the recent currency fluctuations in emerging markets like the South African Rand. This relevance ensures that the strategies and examples aren’t outdated, which could lead you astray.
Keep in mind, forex trading thrives on current information and real-world application—stale content can cause misunderstandings and poor trade decisions.
Using technical analysis PDFs effectively means not just storing files but actively engaging with them, revisiting examples, and applying knowledge to live or demo trades. With clear, relevant, and practical PDFs, you gain a powerful tool to support your journey in forex trading, especially in South Africa’s unique financial landscape.
Putting technical analysis into practice is where theory meets the real world in forex trading. It’s one thing to understand indicators, charts, and patterns; it’s another to apply them reliably to actual trades. This section dives into combining those tools effectively, avoiding common mistakes, and using demo accounts to sharpen your skills without risking money. Traders in South Africa, and anywhere really, benefit greatly when they transition from just knowing the tools to creating a system that works for them.
Consistently successful traders don’t rely on just one indicator or pattern. Instead, they build a trading plan that weaves these elements together into a coherent strategy. For example, a trader might use a 50-day moving average to identify trend direction and an RSI (Relative Strength Index) to spot potential reversals. When the RSI dips below 30 (oversold) while the price touches a known support level, confirmed by a bullish candlestick pattern, the odds favour a buy trade.
Creating a consistent trading plan means setting clear rules for entry, exit, and risk management. Your plan might say: enter a trade only when at least two indicators agree on the direction, and never risk more than 2% of your account on a single trade. This discipline can keep emotions in check and prevent impulsive decisions.
Risk management and setting stop-loss levels go hand in hand with the trading plan. No strategy is foolproof, so protecting your capital is paramount. Stop-loss orders limit potential losses by automatically closing a trade when the price moves against you beyond a set point. For instance, if you buy EUR/ZAR at 18.50, you might place your stop-loss at 18.40 to cap losses at 10 cents per unit. Recognising support and resistance zones helps in placing stop-loss orders sensibly—not too tight to avoid being stopped out by normal market noise, but close enough to manage risk effectively.
Even the best tools can trip traders up if not used wisely. One common pitfall is putting too much trust in a single tool. For example, relying solely on moving averages might miss momentum shifts or underlying volume changes. It’s like trying to judge a movie just by the trailer—you get part of the picture but miss deeper nuances. Combining indicators and patterns provides a fuller view and reduces the risk of false signals.
Another frequent mistake is neglecting market context. It’s easy to focus exclusively on charts and ignore bigger economic or geopolitical events that can suddenly shift forex trends. For instance, during a surprise policy announcement by the South African Reserve Bank, technical signals might contradict actual price moves dictated by fundamentals. Being aware of these factors helps temper expectations and avoid costly misunderstandings.
Demo accounts are the trader’s playground, offering a risk-free environment to test strategies and get comfortable with platforms. Practising strategies without financial risk allows you to trade real market conditions without the stress of losing money. It’s like learning to drive in an empty parking lot before hitting the highway.
Tracking performance in a demo account is crucial. Keep a trading journal noting down entry points, exit points, reasons for trades, and results. Over time, review your journal to identify patterns in your successes and mistakes. This reflection helps refine your methods, whether it’s adjusting indicator thresholds or improving stop-loss placement. Think of it as your personal lab for moulding raw technical knowledge into a skillful trading craft.
Practice without risk, but plan with discipline. That’s the essence of turning technical analysis into profitable trading.
Applying technical analysis in your trading demands more than understanding charts and indicators—it requires systematizing your approach, managing risks carefully, and learning from every trade, including those on demo accounts. This practical step is what separates casual dabblers from traders who build lasting results in the forex market.
Wrapping up your journey through forex trading technical analysis, it's clear that understanding and regularly refining your skills is essential for long-term success. This section highlights why continuously learning and adapting is just as important as mastering the charts and indicators themselves. Whether you're a trader in Johannesburg or Cape Town, the market keeps changing, and so should your strategies.
Markets are like shifting sands—they rarely stay put for long. Staying attuned to economic events, currency policies, and geopolitical developments can drastically affect forex prices. For instance, sudden policy shifts from the South African Reserve Bank or unexpected news from the US Federal Reserve can cause sharp moves in pairs like USD/ZAR.
Keeping up with these changes means subscribing to reliable financial news services, checking weekly economic calendars, and joining local trader forums. This practical habit helps you anticipate market sentiment and adjust your technical setups accordingly.
Even the best strategies can grow rusty without review. Set aside time monthly or quarterly to revisit your approaches. Did your moving average crossovers work as expected this past quarter? Were your stop-loss levels set too tight or too loose?
Reevaluating your techniques helps spot blind spots and hone your trading plan. For example, you might find combining RSI with volume analysis offered better entry timing than RSI alone. This ongoing review turns trial and error into consistent improvement.
Investing in a few solid forex books can deepen your understanding beyond PDFs and videos. Titles like "Trading in the Zone" by Mark Douglas provide insights into trader psychology, while "Technical Analysis of the Financial Markets" by John Murphy is a classic for chart interpretation.
Don’t overlook reputable websites like BabyPips or Forex Factory—they offer forums, strategy ideas, and timely market news tailored for forex traders. Regularly exploring these resources sharpens your ability to spot fresh techniques and verify your analysis.
South Africa offers several hands-on training options. Companies like Traders Circle in Johannesburg or online courses from FXTM provide workshops and lessons geared toward both beginners and experienced traders.
Engaging in local classes gives you the chance to discuss challenges directly with instructors and peers, fostering practical learning and networking. If in-person sessions aren't an option, accredited online programs offer flexibility with live Q&As and community support.
The key takeaway: Your forex education doesn’t stop after mastering basics. Trading success comes from ongoing effort, staying curious, and using every tool—books, websites, courses—to stay a few steps ahead.
By actively updating your skills and tapping into reliable resources, you build a solid, adaptable foundation that can weather the forex market’s ups and downs.
📈 Explore the essentials of forex trading in South Africa: understand currency pairs, effective strategies, market risks, and steps to start trading confidently.

Explore forex trading in Yokohama 🌏 with insights on brokers, regulations, local market tips, and strategies to trade smart and manage risks effectively.

🔍 Learn how forex trading systems work with a practical guide covering strategies, risk control, and tools to help South African traders make smart moves in the market.

Explore forex trading in Johannesburg 🇿🇦 with insights on regulations, top platforms, local strategies, and tips for all trader levels. Navigate challenges confidently! 💹
Based on 5 reviews